Analytics Dashboard
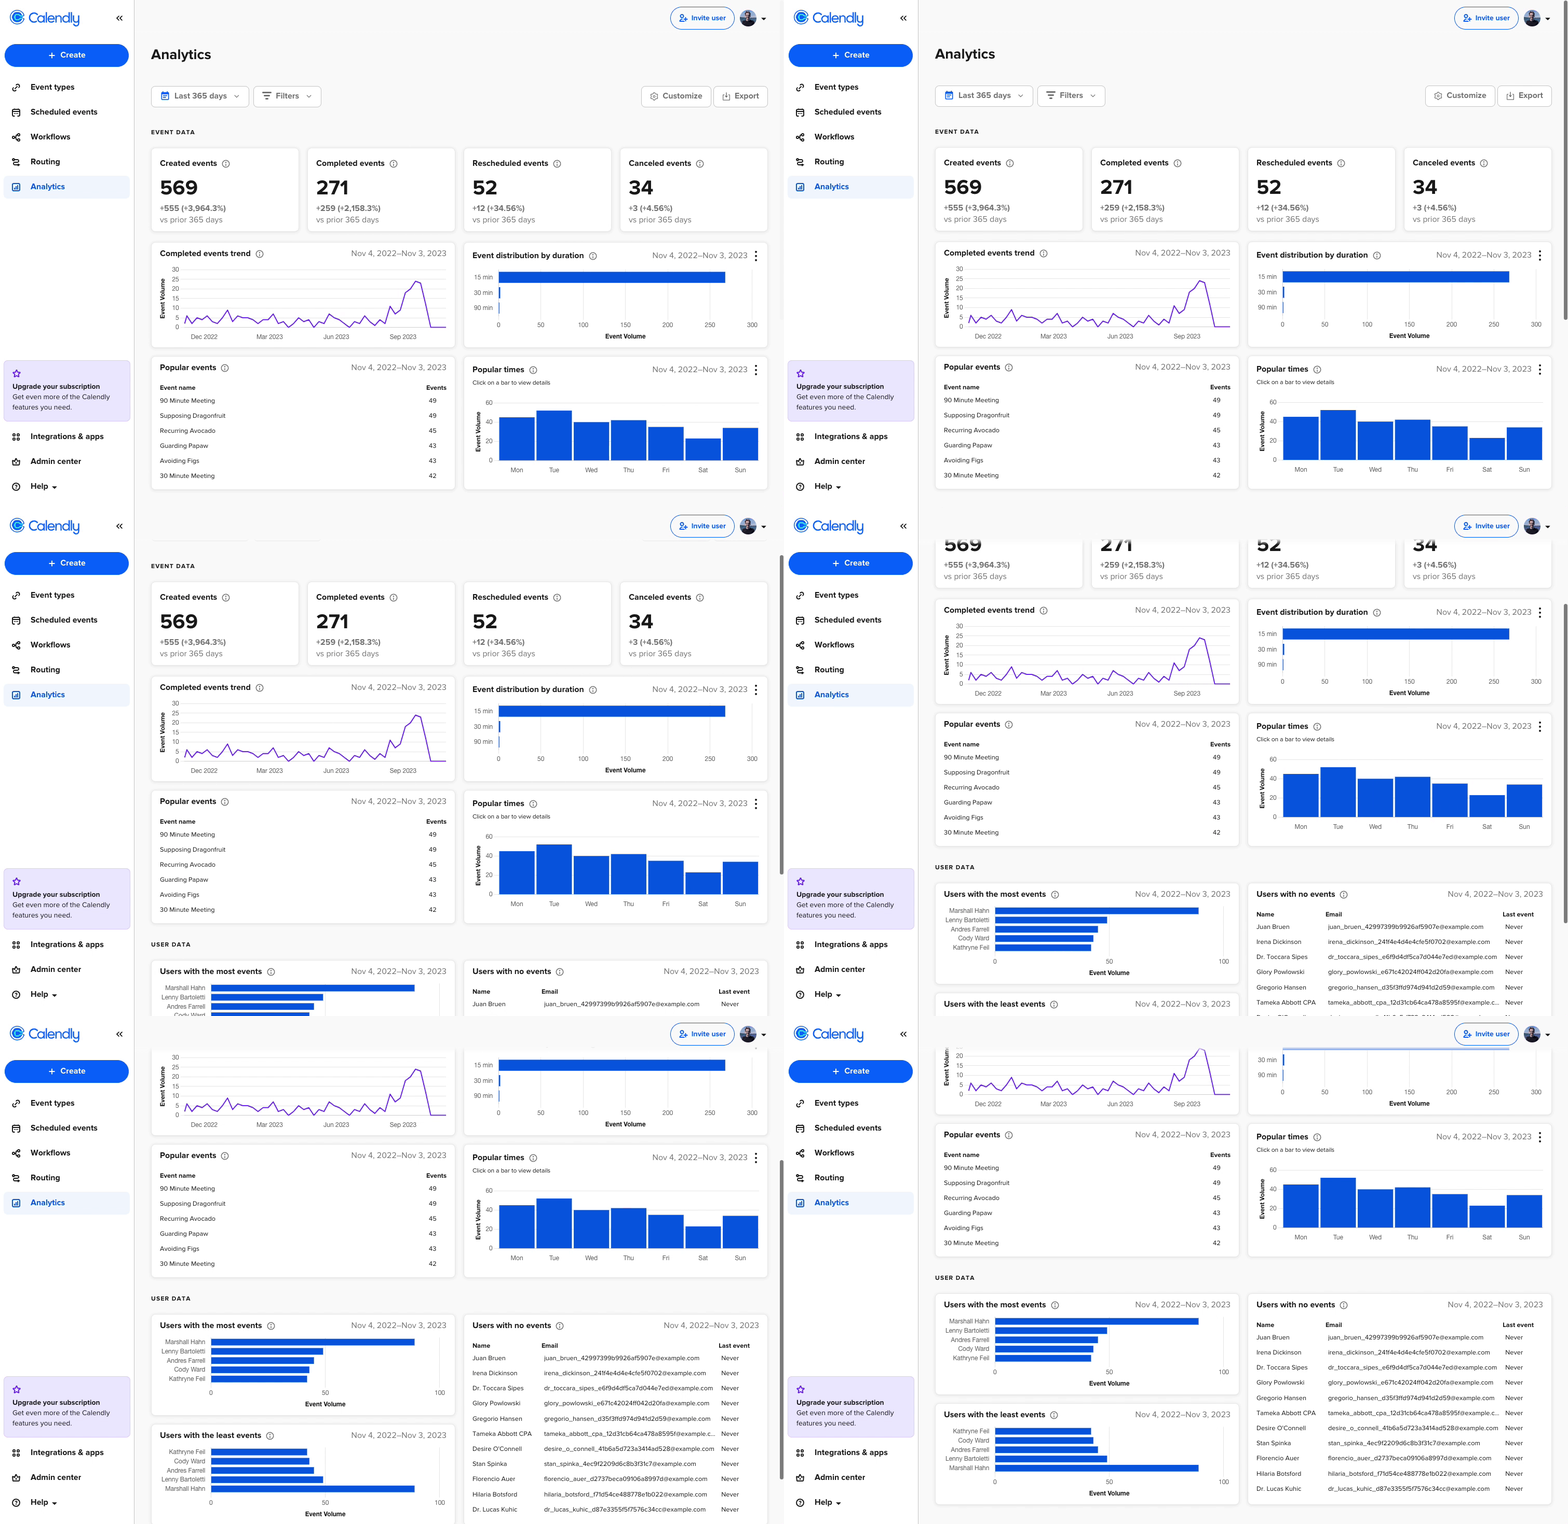
The addition of the analytics dashboard gives Admins a way to easily observe and track meeting patterns and performance in their organization.
Admins have the ability to deduce valuable information regarding favored meeting lengths, the most popular days and times for scheduled and conducted meetings, as well as the highest-achieving teams, groups, and individual users.
The analytics dashboard can be leveraged to accelerate scheduling strategies, achieve meeting goals, and monitor meeting data in an easy manner without having to export data into a CSV file and perform calculations manually; although, it's also possible to export the data from the dashboard.

Filters
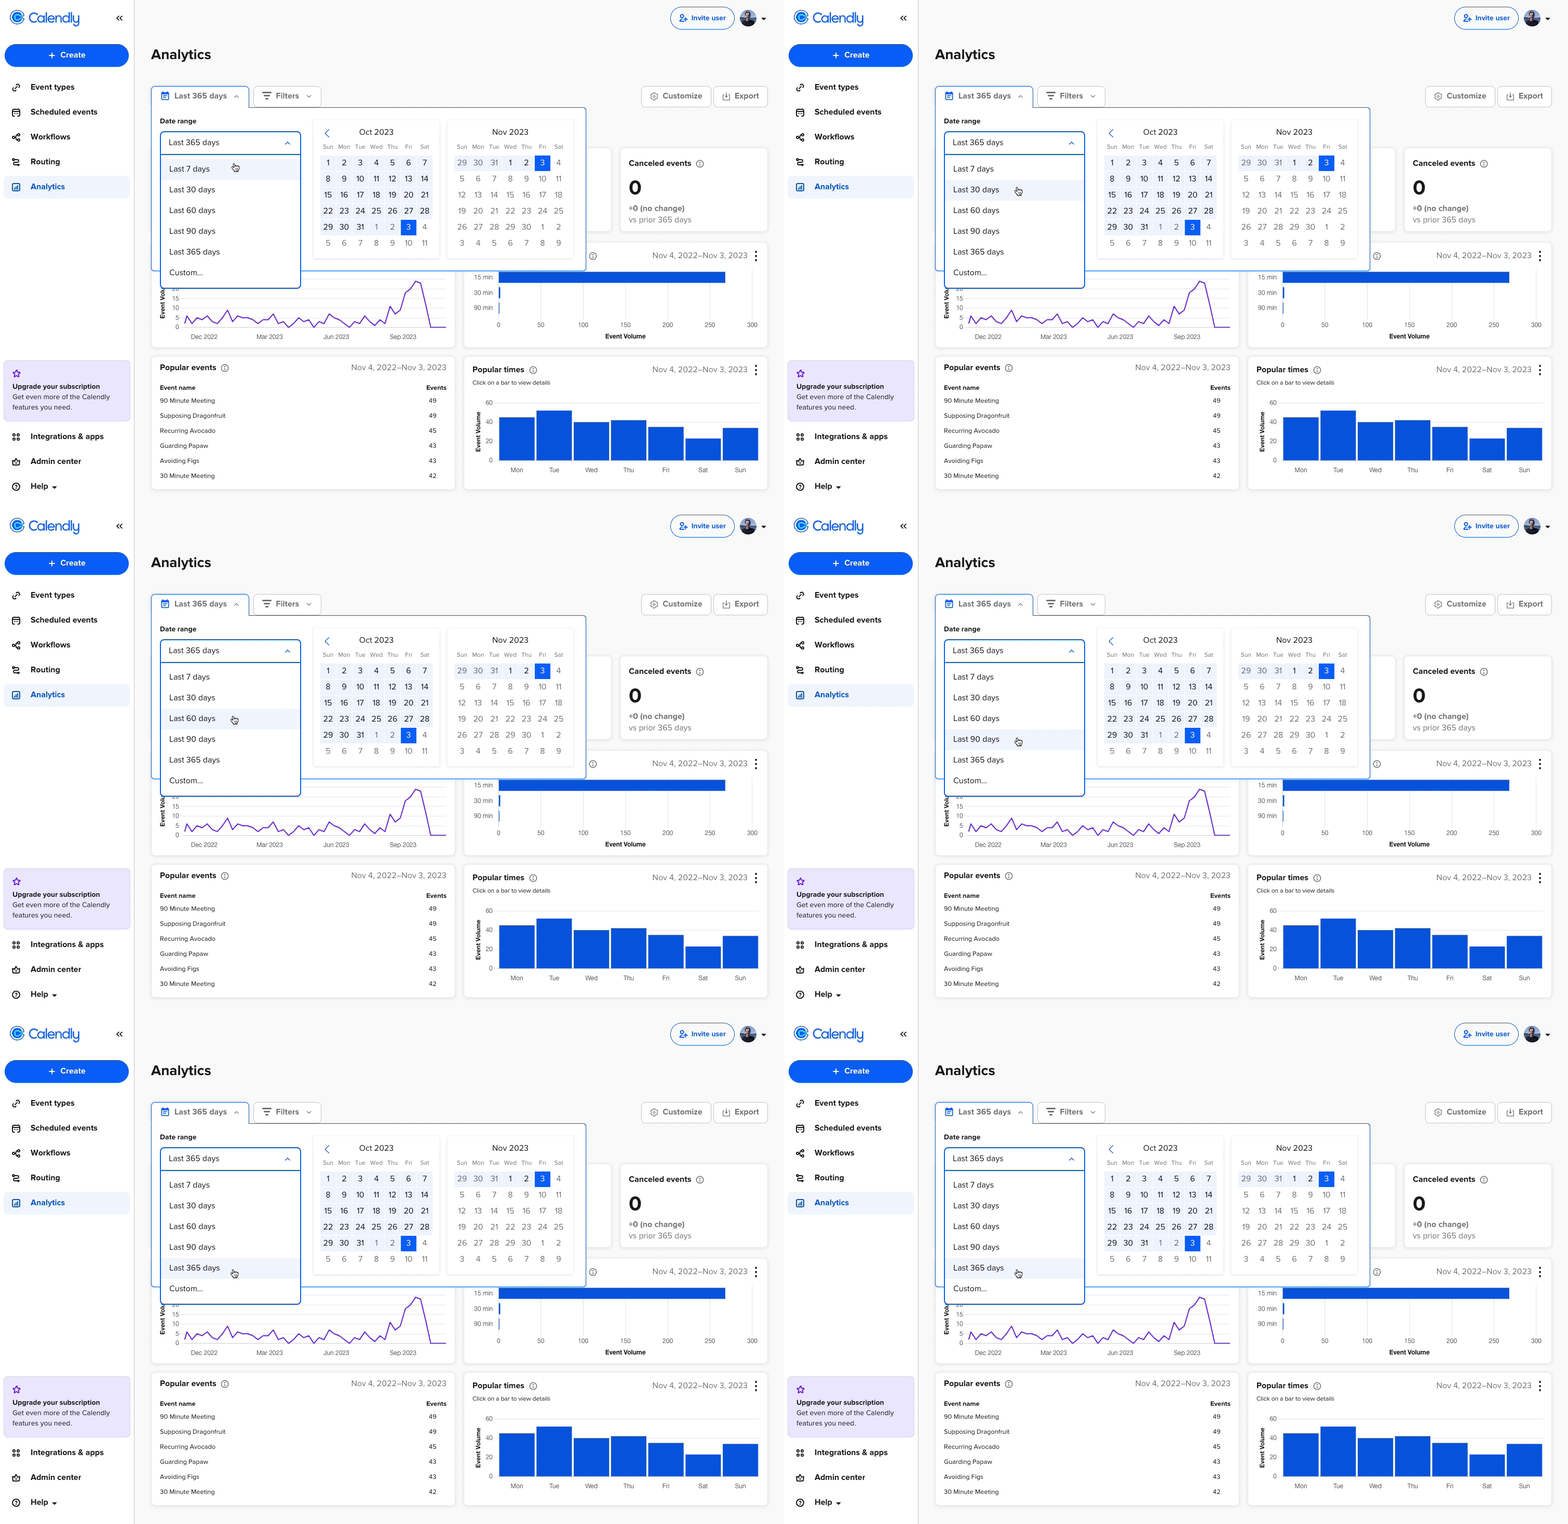
Filters can be applied to narrow down the data on specific date ranges, event types, individuals, teams, or groups.
To filter the dashboard by date, select from any of the date range presets or pick a custom date range.


Customization
Admins also have the flexibility to personalize the dashboard to emphasize the metrics that matter the most to them.

Dashboard Widgets
Key Performance Indicators
Meetings created
Meetings completed
Meetings rescheduled
Meetings canceled

Completed Events Trend

Event Distribution by Duration

Popular Events

Popular Times

Users with the Most and Least Events

Users with No Events

Data Export
In cases where Admins need to download meeting data in a CSV file, data can also be exported conventionally from the dashboard.